What Does The Recent VIX Implosion Mean For The Markets? by Price Headley
In our BigTrends trader meeting this week, one of the major points of discussion brought up by Price Headley and the other portfolio managers was the huge decline seen recently in the CBOE Volatility Index (VIX) (VXX) (VXZ). The VIX dropped from an intra-day high of 31.28 on March 16th to an intra-day low of 17.07 on March 25th — such a rapid plunge/implosion in the VIX occurs rarely in our experience. So we decided to look back at previous data to see how the market performs follwing such a sharp drop in this measure of index option implied volatility (and a good measure of sentiment among option traders).
The VIX data used was from the CBOE website and covers 2004 to the present. The recent VIX drop measured over 45% in decline from peak to trough, and that is certainly a rare occurrence during this 7 year time frame. The only other occurrences of a 40% or more drop in the VIX over 8 trading days were in March 2007, August 2007, and October/November 2008. How did the market react following similar VIX plunges? Take a look at the charts below....
.Taking a look at the S&P 500 Index (SPY) (SPX) in March 2007 following the VIX plunge, you can see below that we had a steady 2 month plus rally in the markets. Also note that our smoothed Williams Percent R reading (bottom of the chart) broke above the 50 mid-level following this signal and quickly moved into strongly bullish territory, indicating overall market strength of trend.
SPY Performance Following March 2007 VIX Drop
The next occurrence was in August 2007, see the chart below. In this case the market also rallied nicely in the daily trend following the signal, however in this case the rally petered out after about 1.5 months and subsequently reversed lower. Note again here a similar upward move in Percent R that, although a bit more whippy, did show some strength.
SPY Performance Following August 2007 VIX Drop
The most recent similar pattern was in Oct/Nov 2008 — in this case we saw a very different market reaction to a short-term VIX implosion. The market sold off fairly sharply in the 2 weeks following this event, and in general drifted lower on a less sharp trajectory over the next several months. We then had the famous culminating panic bottom of March 2009. Note here that Percent R did not move above the 50 mid-level following this VIX move and basically stayed below or around mid-levels for some time.
SPY Performance Following October/November 2008 VIX Drop
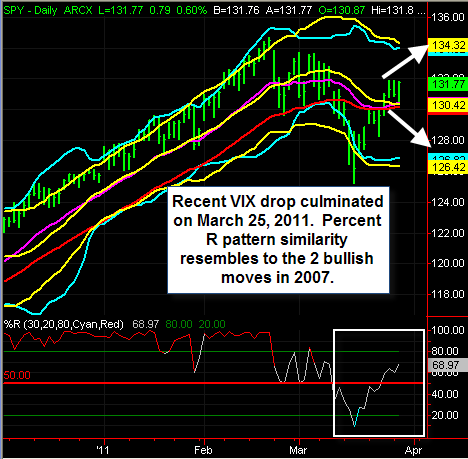
Now we come to the current market situation, with the VIX implosion only having occurred a couple of trading days ago. What will be the move this time around? Well, there are not a lot of historical examples to compare so this is a very unusual circumstance … but based on the steady move higher seen in Percent R, we would anticipate that the market will react similar to the 2 moves of 2007, making a net positive move over the next 1 to 2 months likely.
Current SPY Daily Chart
Bottom Line: The giant drop in option implied volatility seen in recent weeks is unusual in terms of the scope of the VIX plunge. Keep an eye on Percent R and other momentum/trend indicators, as we seem likely to rally in the coming weeks should we hold above mid-levels on this indicator.
Price


Aucun commentaire:
Enregistrer un commentaire